As a business owner or financial analyst, keeping a close eye on your financial metrics is essential to staying on top of your game. That’s where a financial dashboard in Power BI comes into play. Power BI is a data visualization tool that helps businesses analyze and visualize their data to gain insights and make data-driven decisions. In this blog, we’ll explore the benefits of using a financial dashboard in Power BI.

What is a Financial Dashboard in Power BI?
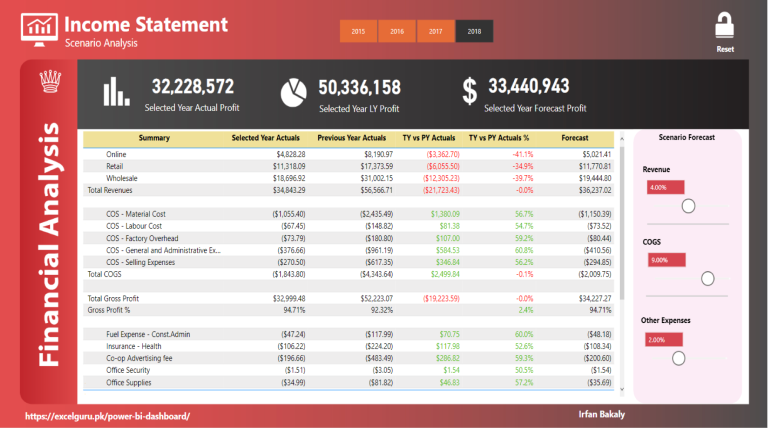
A financial dashboard in Power BI is a visual representation of a company’s financial data. It displays all the key metrics, financial ratios, KPIs, and charts that allow businesses to monitor their financial health, analyze trends, and identify areas that need improvement. With a financial dashboard, businesses can track their performance in real-time, make informed decisions, and adjust their strategies accordingly.
Why Use a Financial Dashboard in Power BI?
There are several reasons why a business should use a financial dashboard in Power BI:
Simplifies data analysis: A financial dashboard in Power BI simplifies the analysis of financial data by presenting it in a way that is easy to understand. It allows businesses to identify trends and patterns, and quickly spot potential issues that need attention.
Provides real-time insights: With a financial dashboard in Power BI, businesses can monitor their financial performance in real-time. This means that they can quickly make adjustments to their strategies to ensure they are meeting their financial goals.
Enables informed decision-making: A financial dashboard in Power BI provides businesses with the information they need to make informed decisions. It helps them to identify areas that need improvement and prioritize their efforts based on their financial data.
Increases efficiency: By using a financial dashboard in Power BI, businesses can save time and resources by automating the data analysis process. This allows them to focus on other important areas of the business.
What Metrics Should Be Included in a Financial Dashboard in Power BI?
The metrics that should be included in a financial dashboard in Power BI will vary depending on the type of business and the goals of the dashboard. However, some common metrics that businesses should consider include:
Revenue: Revenue is a key metric that shows how much money a business is generating. It can be broken down by product, service, or region.
Expenses: Expenses are the costs associated with running a business. It’s essential to track these to identify areas where the business can cut costs.
Profitability: Profitability is a metric that shows how much profit a business is generating. It’s calculated by subtracting expenses from revenue.
Cash flow: Cash flow is the money that is coming in and going out of a business. It’s important to track this to ensure that the business has enough cash to operate.
Financial ratios: Financial ratios, such as the debt-to-equity ratio, return on investment, and return on equity, provide insights into a business’s financial health.
Conclusion
In conclusion, a financial dashboard in Power BI is an essential tool for any business looking to monitor its financial health. It simplifies data analysis, provides real-time insights, enables informed decision-making, and increases efficiency. By including key metrics such as revenue, expenses, profitability, cash flow, and financial ratios, businesses can gain a holistic view of their financial performance and make data-driven decisions. With Power BI, businesses can take control of their financial data and gain a competitive edge.